Data Flow Diagram(DFD)
A data flow diagram (DFD) is a visual representation of the information flow through a process or system. DFDs help you better understand process or system operation to discover potential problems, improve efficiency, and develop better processes. They range from simple overviews to complex, granular displays of a process or system.
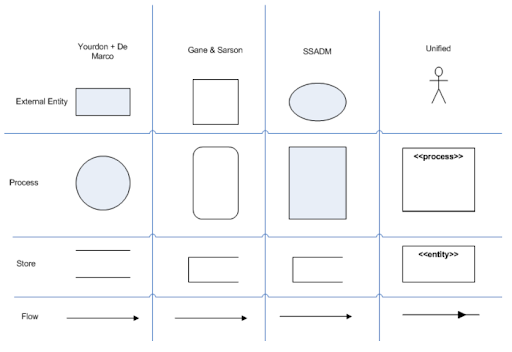
Data Flow Diagram symbols are standardized notations, like rectangles, circles, arrows, and short-text labels, that describe a system or process’ data flow direction, data inputs, data outputs, data storage points, and its various sub-processes. There are four common methods of notation used in DFDs: Yourdon & De Marco, Gene & Sarson, SSADM and Unified. All use the same labels and similar shapes to represent the four main elements of a DFD — external entity, process, data store, and data flow.
Levels of Data Flow Diagrams
DFDs can range from simple overviews to complex, granular representations of a system or process with multiple levels, starting with level 0. The most common and intuitive DFDs are level 0 DFDs, also called context diagrams. They’re digestible, high-level overviews of the flow of information through a system or process, so almost anyone can understand it.
-
Level 0: Context Diagram This DFD level focuses on high-level system processes or functions and the data sources that flow to or from them. Level 0 diagrams are designed to be simple, straightforward overviews of a process or system.
-
Level 1: Process Decomposition While level 1 DFDs are still broad overviews of a system or process, they’re also more detailed — they break down the system’s single process node into subprocesses.
-
Level 2: Deeper Dives The next level of DFDs dive even deeper into detail by breaking down each level 1 process into granular subprocesses.
-
Level 3: Increasing Complexity Level 3 and higher-numbered DFDs are uncommon. This is largely due to the amount of detail required, which defeats its original purpose of being easy to understand.
Resources
To learn more, the best place to start is https://www.lucidchart.com/pages/data-flow-diagram/how-to-make-a-dfd